The purpose of this document is to report the findings of a load test that was performed on the 2.3 RC3 version of Icecast.
This load test was not designed to be a complete and total analysis of how Icecast behaves under load, but rather provide some insight into what happens to Icecast when load (i.e. listeners) increases.
The main goal was to answer the following questions:
In order to test a large number of listeners, I knew that the network would be the first
limiting factor. So for this reason, I performed this test using gigabit ethernet (1000 Mbit/sec)
cards in each of the machines.
There were 3 machines used in the test, 1 to run icecast (and icecast only), and 2 to serve as “listeners”.
The specs of each of the boxes were identical and looked like:
We simulated listeners with the following script:
#!/bin/sh
#
# run concurrent curls which download from URL to /dev/null.  output total
# and average counts to results directory.
#

# max concurrent curls to kick off
max=7000
# how long to stay connected (in seconds)
duration=99999999
# how long to sleep between each curl, can be decimal  0.5
delay=10
# url to request from
URL=http://dwrac1:8500/stream.ogg


#####
#mkdir -p results
echo > results
while /bin/true
do
count=1
while [ $count -le $max ]
do
   curl -o /dev/null -m $duration -s -w "bytes %{size_download} avg %{speed_download} " "$URL" >> results &
   curl -o /dev/null -m $duration -s -w "bytes %{size_download} avg %{speed_download} " "$URL" >> results &
   curl -o /dev/null -m $duration -s -w "bytes %{size_download} avg %{speed_download} " "$URL" >> results &
   curl -o /dev/null -m $duration -s -w "bytes %{size_download} avg %{speed_download} " "$URL" >> results &
   curl -o /dev/null -m $duration -s -w "bytes %{size_download} avg %{speed_download} " "$URL" >> results &
   curl -o /dev/null -m $duration -s -w "bytes %{size_download} avg %{speed_download} " "$URL" >> results &
   curl -o /dev/null -m $duration -s -w "bytes %{size_download} avg %{speed_download} " "$URL" >> results &
   curl -o /dev/null -m $duration -s -w "bytes %{size_download} avg %{speed_download} " "$URL" >> results &
   curl -o /dev/null -m $duration -s -w "bytes %{size_download} avg %{speed_download} " "$URL" >> results &
   curl -o /dev/null -m $duration -s -w "bytes %{size_download} avg %{speed_download} " "$URL" >> results &
   curl -o /dev/null -m $duration -s -w "bytes %{size_download} avg %{speed_download} " "$URL" >> results &
   [ "$delay" != "" ] && sleep $delay
   let count=$count+10
done
wait
done
echo "done"
This script was run on each of the 2 load driving nodes. This script will incrementally add listeners to the icecast server at regular intervals; 10 listeners would be added every 10 seconds (with 2 machines, that’s a total of 20 listeners every 10 seconds). I ran this script for about 2 hours before it ended up forking too many processes for the load driving boxes.
A note about configuration of the icecast box and the load drivers. For the load test I used a stock RHEL3 kernel and bumped up the max file descriptors to 30000 (default was 1024).
In addition to the load driving script, I used a custom-written tool that I wrote for doing performance testing of my own. In this case, I just used the “data gathering” and graphing portion of it. With this tool I captured basic system stats from each machine along with the listener count on the icecast server. These stats were all correlated together and I created graphs to represent the data.
For this test, only one stream was being sent to icecast, and it was being sourced using an OddcastV3 client sending a ~12kbps vorbis stream (Aotuvb4, quality -2, 11025Hz, Mono).
The first graph shows user and system CPU usage for the box as a function of listeners.
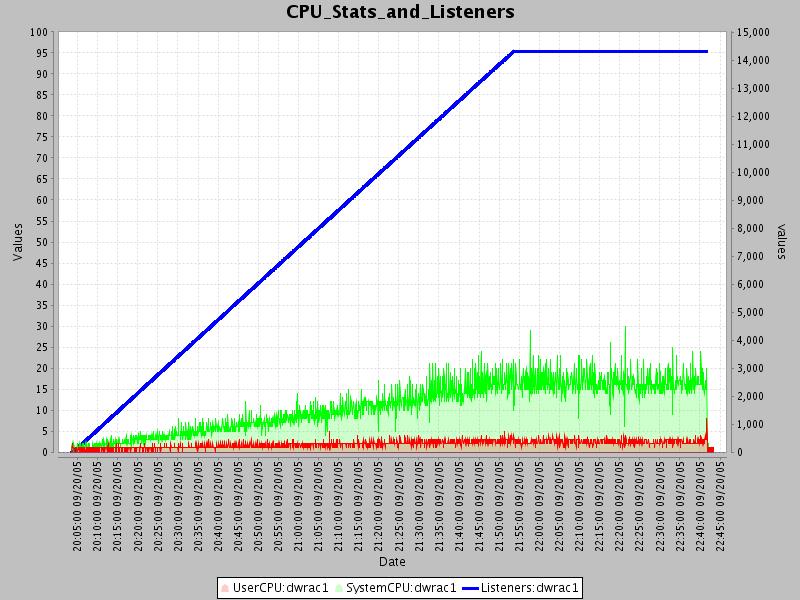
From this graph, you can see that the maximum number of listeners that I could simulate was about 14000. It is important to note that this is not a limitation of icecast, but rather of the hardware that I used. It can be seen that the total cpu utilization is about 20% at 14000 listeners, with a breakdown of ~ 15% system and 5% user CPU. It can also be seen that system and user CPU utilization basically follows a fairly linear progression upwards, so if you assume this, I would calculate the max number of listeners capable on a single Icecast instance (given similarly sized hardware to mine) would be 14000 * 4 = 56000 (you probably don’t want to run at > 80% cpu utilization).
Speaking of network activity, the next graph shows network packets sent out by the Icecast box as a function of listeners.
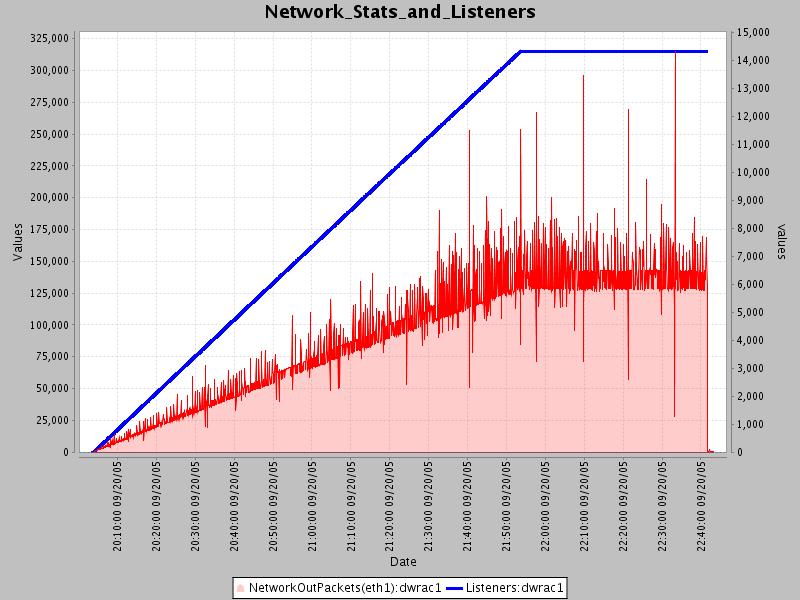
It can be seen that network packets increase linearly with listeners just as CPU did. Note that these
metric are in “packets”, not in “bytes”, so it’s not exactly clear at what point the network would become
saturated. However given that each client is retrieving a 12kbps stream, with 14000 clients that would be
14000 * 12 = 168,000 bps + 10% TCP Overhead = ~ 184Mbps. So we had plenty of room for more listeners
with a GBit card. And using our derived max of 56000 listeners and assuming the 12kbps stream rate that
we used, that would mean:
56000 * 12 + 10% TCP Overhead = ~ 740Mbps.
Note that most broadcasters don’t use 12kbps for a stream, so I would say that for MOST broadcasters, you will almost always be limited by your network interface. Definitely if you are using 10/100 equipment, and quite possibly even if using GBit equipment.
So to answer our questions:
Well, we know that it can definitely handle 14000 concurrent users given a similarly sized hardware configuration. We all conclude that icecast itself can handle even more concurrent users, with the main limitation most likely being the network interface.
Looks like icecast follows a rather linear progression of cpu utilization with about 1/4 of the total CPU time spend in user time, and the other 3/4 in system time. For 14000 concurrent users I saw 20% total utilization, with a breakdown of 5% user and 15% system.
