Ok, here we go with another Icecast load test. In this test we are going to try to answer the following questions:
I used the same hardware as in the first load test.
2 of these (one for running Icecast, and one for sources/listeners):
For this particular load test we used the same listener load script from the first load test, and added a new script for creating source clients.
We created mountpoints with the following script:
#!/bin/sh
#
max=700
# how long to sleep between each set of ezstreams, can be decimal  0.5
delay=2

echo > out
count=1
while [ "$count" -le "$max" ]
do
   ezstream -c conf/ezstream_mp3_$count.xml >> out &
   ezstream -c conf/ezstream_vorbis_$count.xml >> out &
   let count=$count+1
   ezstream -c conf/ezstream_mp3_$count.xml >> out &
   ezstream -c conf/ezstream_vorbis_$count.xml >> out &
   let count=$count+1
   ezstream -c conf/ezstream_mp3_$count.xml >> out &
   ezstream -c conf/ezstream_vorbis_$count.xml >> out &
   let count=$count+1
   ezstream -c conf/ezstream_mp3_$count.xml >> out &
   ezstream -c conf/ezstream_vorbis_$count.xml >> out &
   let count=$count+1
   ezstream -c conf/ezstream_mp3_$count.xml >> out &
   ezstream -c conf/ezstream_vorbis_$count.xml >> out &
   let count=$count+1
   [ "$delay" != "" ] && sleep $delay
done
wait
echo "done"
This script creates 10 new source client connections (5 MP3 and 5 Vorbis) every 2 seconds.
The config files (exstream_*.xml) were all precreated and were all identical with the exception
of the mountpoint (which was a counter from 1 to 1400). These ezstream instances looped the same
file over and over (metadata updates were perform in between each loop - this is automatically done by ezstream).
The idea here is to ramp up (in a regular fashion) the number of source clients to a value of 1400. Why 1400 ? Well, 1400 sources ended up with a VSZ of 1GB, and while I probably could have gone higher, the purpose of this test was not to see the max number of sources that can be attached, but rather can a large number of them be attached without icecast saturating somewhere, and what kind of memory/cpu was taken up by such a “large number” source test.
So let us try to determine how much memory is taken by each source client. We will measure this by
looking at the VSZ value for icecast (as reported by ps -aux).
The first graph shows VSZ and source count.
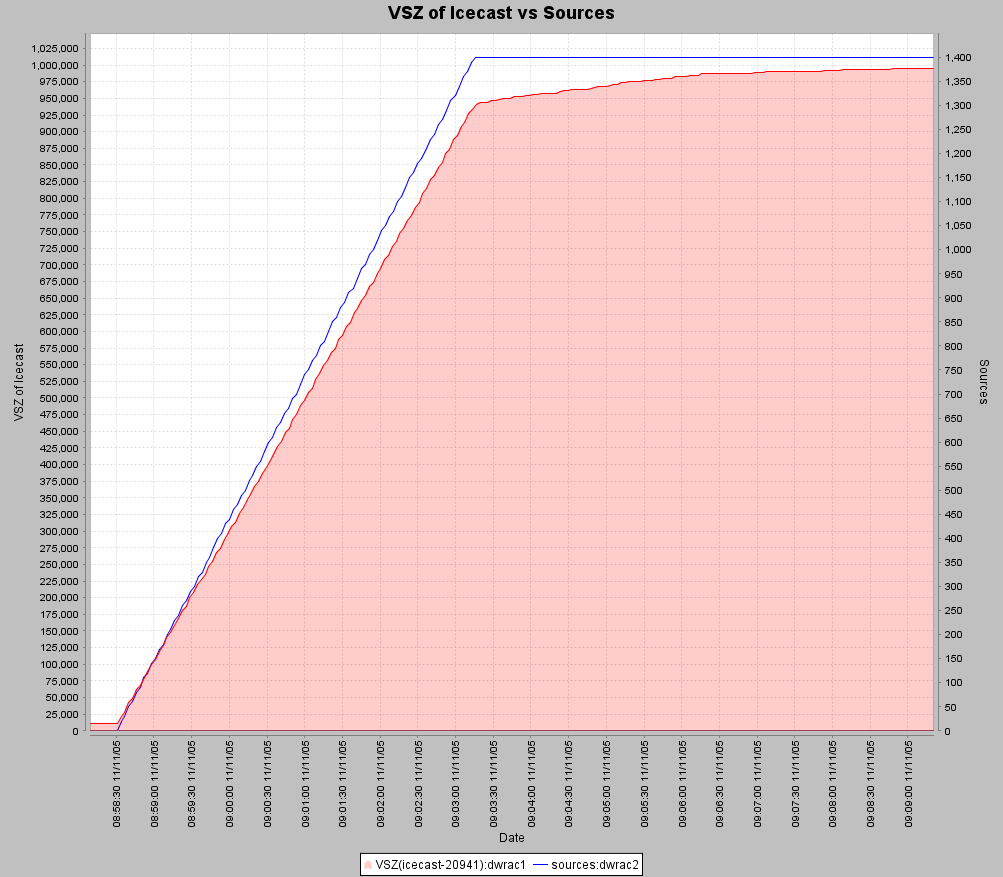
So lets take a look at some of the raw data, here is the VSZ and source number values, along with a
delta representing the different between the current and previous VSZ value divided by the number of
sources that were added. This effectively represents the KB overhead per source.
Note that VSZ is reported in KB.
| VSZ Icecast | Number of Sources | Delta per source |
|---|---|---|
| 10648 | 0.00 | |
| 21512 | 20.00 | 543.20 |
| 28012 | 30.00 | 650.00 |
| 41836 | 50.00 | 691.20 |
| 48308 | 60.00 | 647.20 |
| 61388 | 80.00 | 654.00 |
| 68008 | 90.00 | 662.00 |
| 79772 | 110.00 | 588.20 |
| 88440 | 120.00 | 866.80 |
| 100336 | 140.00 | 594.80 |
| 107704 | 150.00 | 736.80 |
| 118568 | 170.00 | 543.20 |
| 128520 | 180.00 | 995.20 |
| 140900 | 200.00 | 619.00 |
| 147112 | 210.00 | 621.20 |
| 158020 | 230.00 | 545.40 |
| 168340 | 240.00 | 1032.00 |
| 180912 | 260.00 | 628.60 |
| 186864 | 270.00 | 595.20 |
| 200940 | 290.00 | 703.80 |
| 207288 | 300.00 | 634.80 |
| 219812 | 320.00 | 626.20 |
| 227348 | 330.00 | 753.60 |
| 234200 | 350.00 | 342.60 |
| 247384 | 360.00 | 1318.40 |
| 254232 | 380.00 | 342.40 |
| 267556 | 400.00 | 666.20 |
| 274164 | 410.00 | 660.80 |
| 287348 | 430.00 | 659.20 |
| 294196 | 440.00 | 684.80 |
| 306760 | 460.00 | 628.20 |
| 313476 | 470.00 | 671.60 |
| 327072 | 490.00 | 679.80 |
| 334944 | 500.00 | 787.20 |
| 346900 | 520.00 | 597.80 |
| 354636 | 530.00 | 773.60 |
| 366304 | 550.00 | 583.40 |
| 374184 | 560.00 | 788.00 |
| 387084 | 580.00 | 645.00 |
| 394820 | 600.00 | 386.80 |
| 406204 | 610.00 | 1138.40 |
| 414984 | 630.00 | 439.00 |
| 427420 | 640.00 | 1243.60 |
| 434136 | 660.00 | 335.80 |
| 447712 | 670.00 | 1357.60 |
| 454556 | 690.00 | 342.20 |
| 466984 | 700.00 | 1242.80 |
| 474740 | 720.00 | 387.80 |
| 488184 | 740.00 | 672.20 |
Average Delta per Source: 693.91
Ok, that’s probably enough data to make a conclusion. Looks like each new addition of a source client is causing an increase of (on average) 672.20KB of memory in the icecast process. This means we’d expect an increase of 1400*.672 = .95GB in the VSZ for Icecast compared to its initial value. From our graph we can see the initial value of ~ 15MB and a final value of .95GB for a net increase in the range that we were expecting.
Next let us look at CPU used by icecast. The following graph shows the CPU utilization
(user/system/wait io) for the box running Icecast. It is important to note that only icecast was
running on this box, so any cpu activity is associated with Icecast. Also note that initially, I
used PCT_CPU as returned by ps -augx, however it was determined that this value was not
representative of actual PCT_CPU of the process. Thus I opted to used the cpu utilization of the
machine itself to get a more accurate representation.
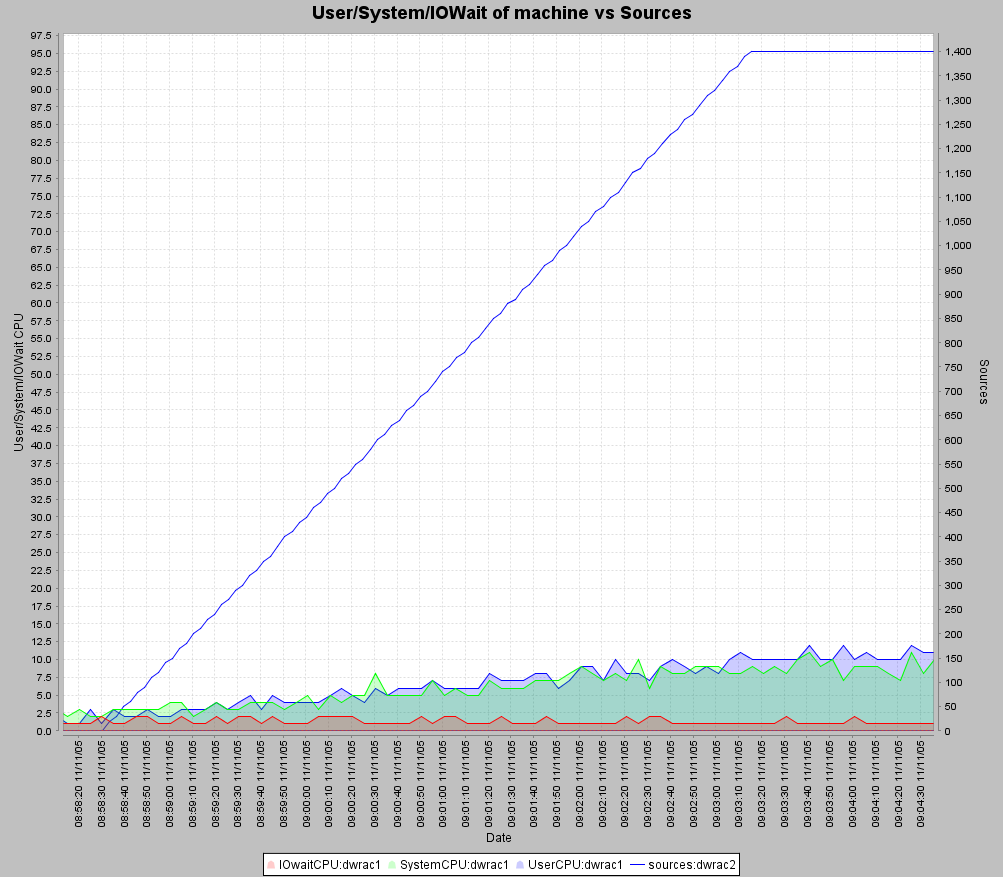
From this graph you can see that total cpu went from about 5% (2.5% user/ 2.5% system) up to about 20% (10% user / 10% system) during the course of the sources attaching. There is a general upward trend in increasing CPU time, however, it is fairly regular and relatively small. So we’d conclude that Icecast is doing a very efficient job in handling this number of sources.
This test is really a combination of the first test I did (max listeners) and this test (max sources) to see how the system reacts to a system with a good number of listeners and sources combined. To start off, source clients were ramped up to 1400 (just like in the First Test), and then I ramped up to 5600 concurrent listeners. These listeners were randomly distributed across the 1400 available attached mountpoints and connected and stayed connected for the duration of the test. Why 5600 ? The machine that I was running listeners on ended up running out of resource (number of processes) at that point.
Let us first take a look at the Icecast process VSZ (Virtual Memory Size).
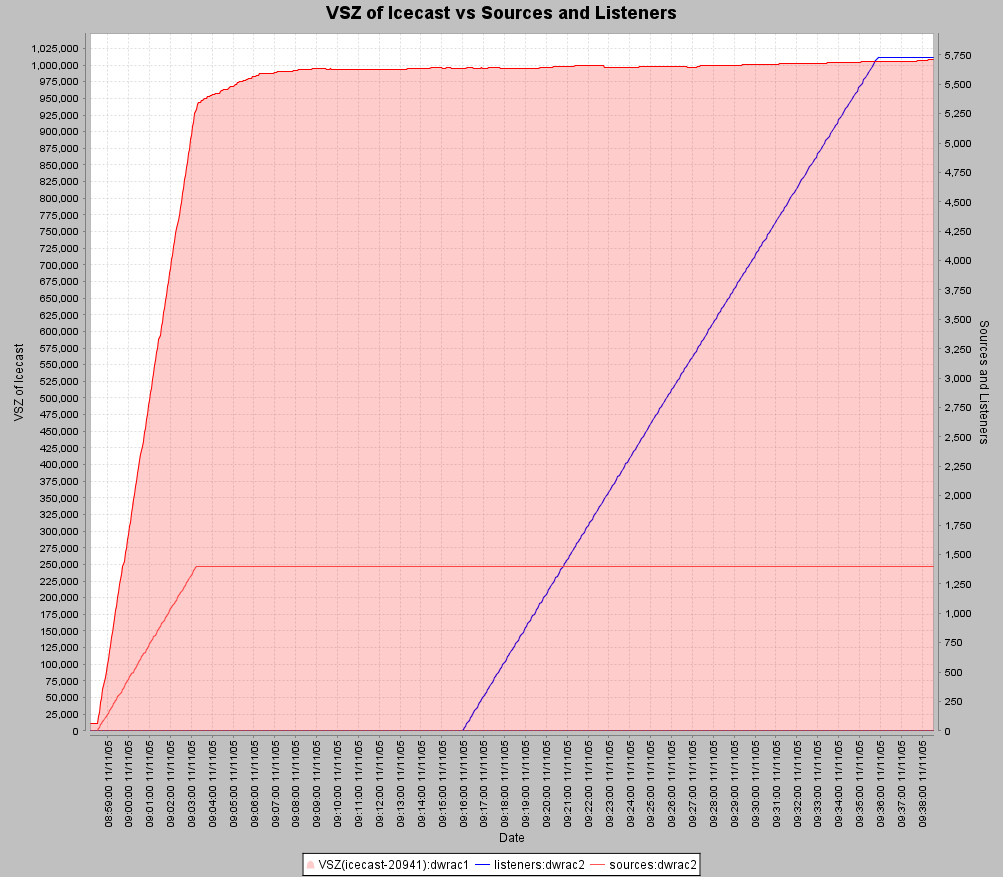
In the above diagram, the sources are represented by a red line and listeners by a blue (red shaded area is the VSZ of Icecast). As can be seen, the VSZ of the icecast process significantly increases with the addition of new sources (this is something that we found and discussed above in this document) but that it remains flat upon the addition of new listeners. This is good news for those of you who want to have a low memory footprint but still want a large number of listeners.
Let us now look at system CPU as a function of these two metrics (source count and listener count). The next graph shows system CPU utilization (User/System/IOWait) as reported by vmstat.
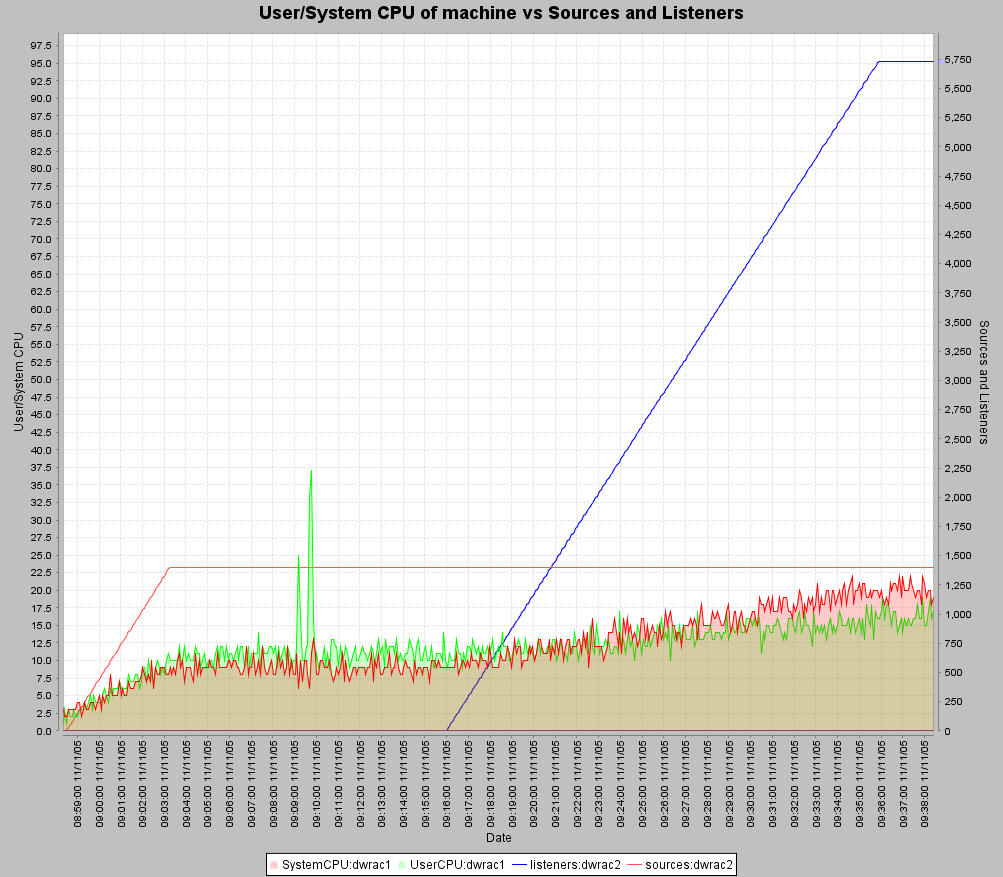
The effects are fairly subtle in this diagram, but what is shown is a relatively constantly increasing cpu utilization during the source client rampup, and a similar increase in CPU utilization during the listener ramp up. The slope of the line representing the increase in CPU utilization seems to be steeper with the source ramp up as compared to the listener ramp up. This would imply that the addition of new sources will imply a larger CPU utilization than the addition of new listeners. This is exactly what we would expect.
So what did we learn from this test? We saw that icecast memory does not appreciably increase with the addition of listeners (which it does with the addition of sources). We also saw that CPU utilization is slightly higher for processing sources than listeners.
The first graph shows user and system CPU usage for the box as a function of listeners.
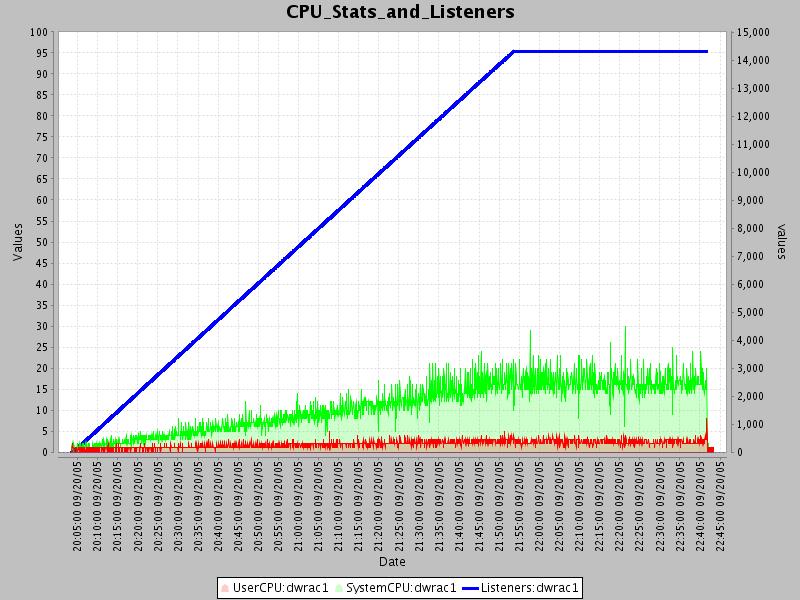
From this graph, you can see that the maximum number of listeners that I could simulate was about 14000. It is important to note that this is not a limitation of icecast, but rather of the hardware that I used. It can be seen that the total cpu utilization is about 20% at 14000 listeners, with a breakdown of ~ 15% system and 5% user CPU. It can also be seen that system and user CPU utilization basically follows a fairly linear progression upwards, so if you assume this, I would calculate the max number of listeners capable on a single Icecast instance (given similarly sized hardware to mine) would be 14000 * 4 = 56000 (you probably don’t want to run at > 80% cpu utilization).
Speaking of network activity, the next graph shows network packets sent out by the Icecast box as a function of listeners.
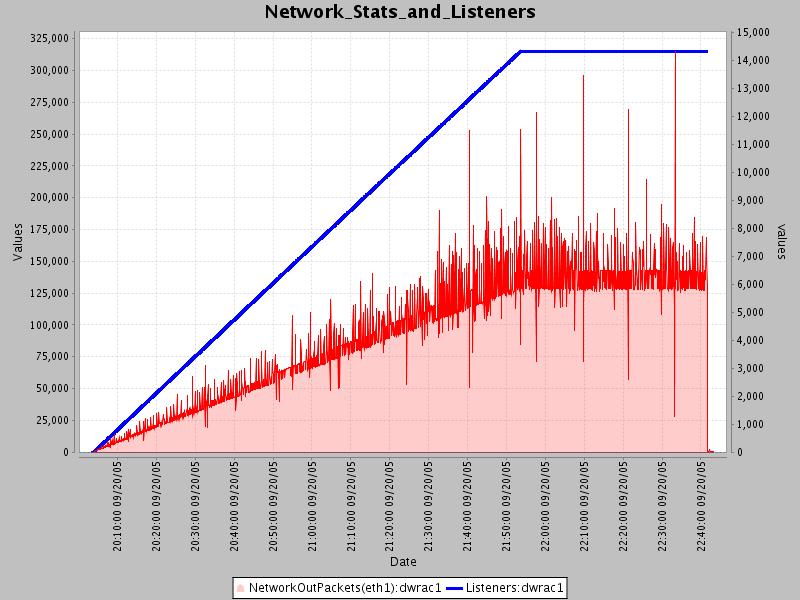
It can be seen that network packets increase linearly with listeners just as CPU did. Note that these
metric are in “packets”, not in “bytes”, so it’s not exactly clear at what point the network would become
saturated. However given that each client is retrieving a 12kbps stream, with 14000 clients that would be
14000 * 12 = 168,000 bps + 10% TCP Overhead = ~ 184Mbps. So we had plenty of room for more listeners
with a GBit card. And using our derived max of 56000 listeners and assuming the 12kbps stream rate that
we used, that would mean:
56000 * 12 + 10% TCP Overhead = ~ 740Mbps.
Note that most broadcasters don’t use 12kbps for a stream, so I would say that for MOST broadcasters, you will almost always be limited by your network interface. Definitely if you are using 10/100 equipment, and quite possibly even if using GBit equipment.
So to answer our questions:
We found that each source client adds about 672KB to the virtual size of the Icecast process. This ends up being the the limiting factor when determining the number of sources you can host on a single Icecast instance.
Certainly there are, I ran into a limit of 1400 on the hardware I used, with the addition of additional RAM I would have been able to increase that value.
We found that listeners do not seem to affect Icecast too much with regard to memory, and that it adds less load to the CPU as do sources. In the case of listeners, the network will be your limiting factor (which we found and reported in our previous load test).
